

Food Tables 101: Digesting the Facts and Figures
Why Food Tables Are Essential for Your Restaurant's Success
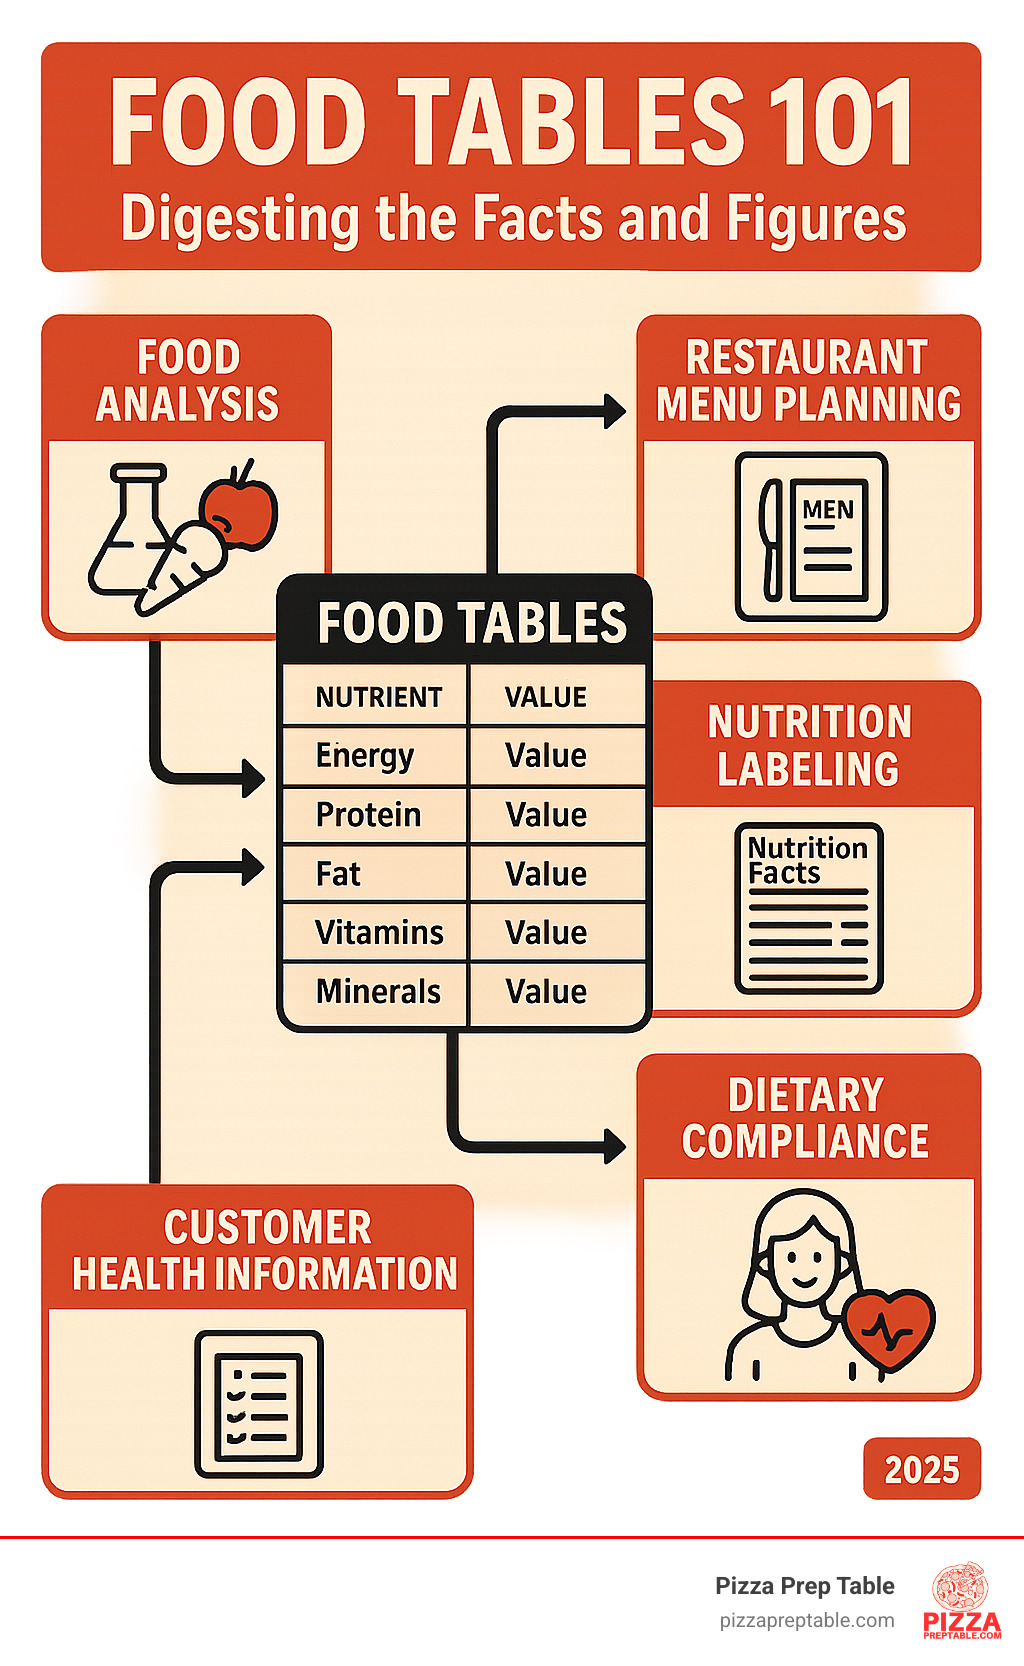
Food tables are standardized databases that list the nutritional content of foods per 100 grams, helping restaurants, nutritionists, and food manufacturers understand exactly what's in the food they serve. These comprehensive references contain data on everything from basic calories and protein to detailed vitamin and mineral profiles.
Key facts about food tables:
- Purpose: Provide standardized nutritional data for menu planning, labeling, and compliance
- Content: Energy, macronutrients (protein, fat, carbs), vitamins, minerals, and other compounds
- Format: Values typically shown per 100g plus common serving sizes
- Sources: Government agencies like USDA, university research, and food industry analysis
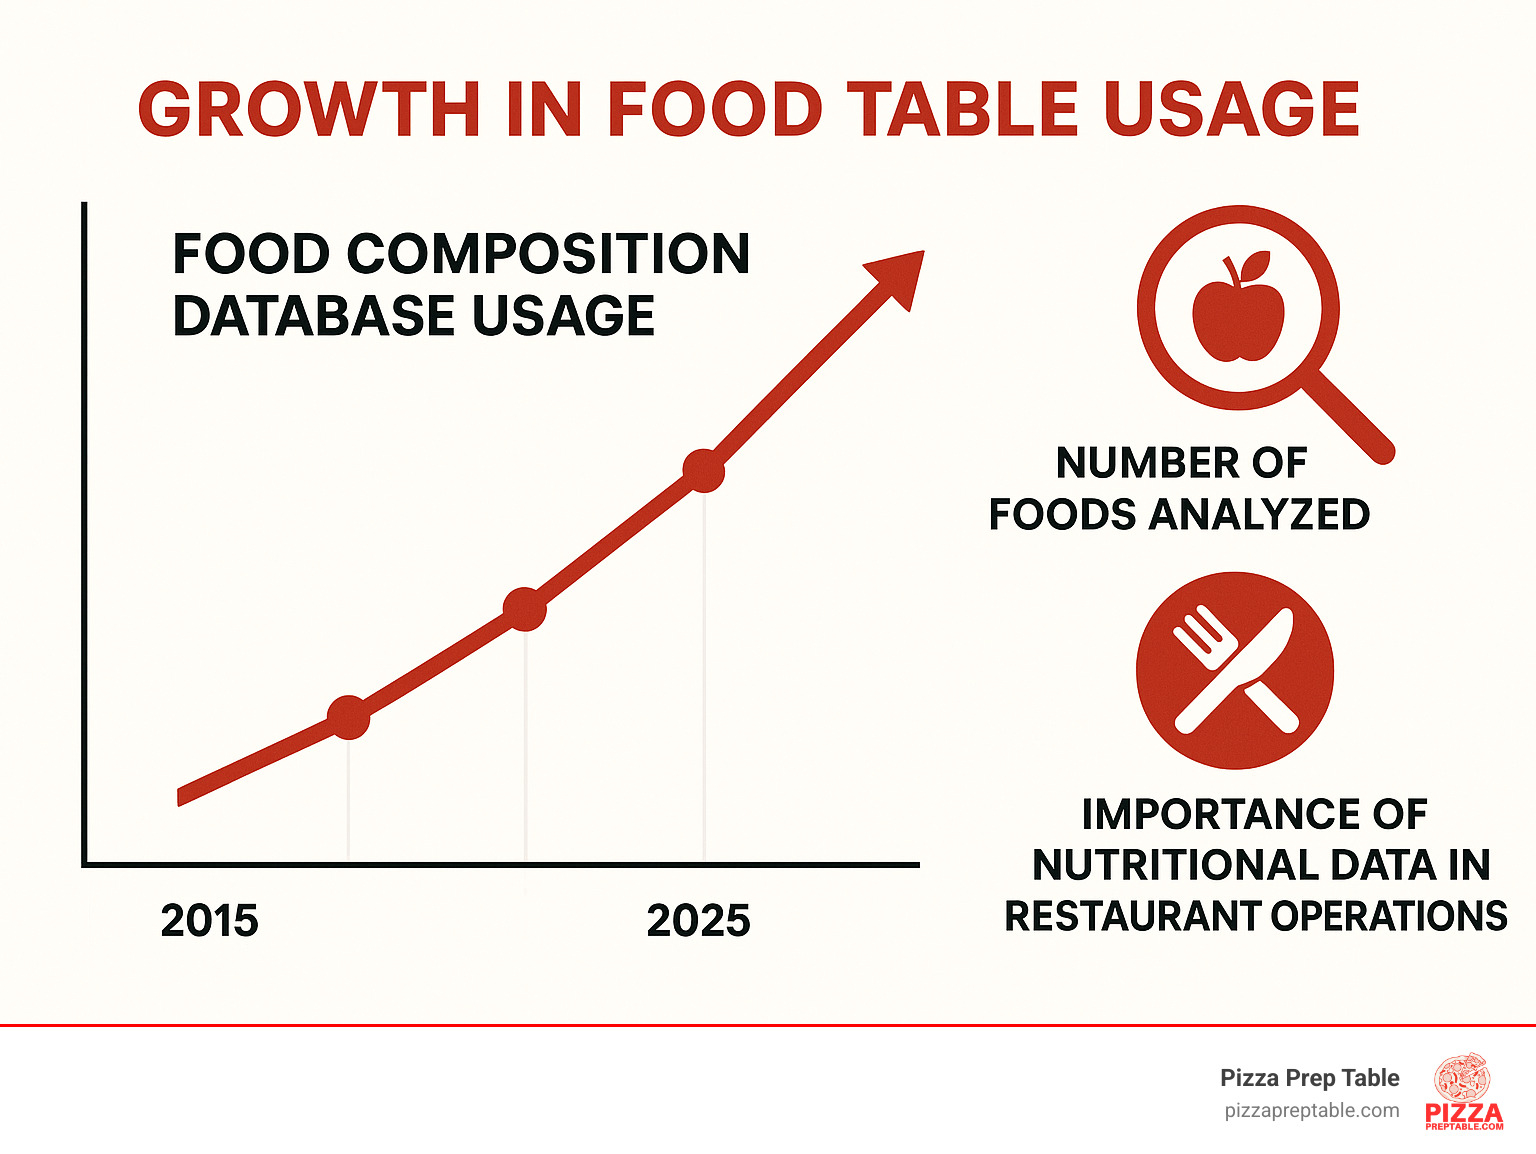
- Updates: Major editions released every 2-3 years with thousands of foods analyzed
- Applications: Nutrition labels, dietary planning, public health policy, and food safety compliance
For restaurant owners, food tables solve critical business challenges. They help you create accurate nutrition labels, plan balanced menus, meet food safety regulations, and make informed purchasing decisions. Whether you're calculating calories for a pizza menu or ensuring your prep meets dietary guidelines, these databases provide the foundation for data-driven food service.
The research shows that comprehensive food tables like New Zealand's FOODfiles contain data for over 2,760 foods with up to 360 components analyzed. Even concise versions cover 1,280+ foods with 38 core nutrients - more than enough detail for most restaurant applications.
I'm Sean Kearney, and my background in sales and deep appreciation for the foodservice industry has shown me how critical accurate nutritional data is for restaurant success. From my experience helping establishments outfit their kitchens to understanding customer needs, I've seen how food tables become essential tools for menu planning, compliance, and building customer trust.
Food Tables Fundamentals
The story of food tables begins with a simple but crucial question: what's actually in our food? These systematic databases emerged from the need to standardize nutritional information across the food industry, changing how we understand and communicate about nutrition.
At their core, food tables serve as the nutritional equivalent of a parts catalog for your car. Just as you need to know the exact specifications of each component in your engine, restaurants need precise data about the nutritional components in their ingredients. This standardization allows for consistent nutrition labeling, accurate dietary planning, and reliable food safety compliance across the industry.
The compilation process is more complex than many realize. Food scientists collect samples from multiple sources, accounting for seasonal variations, different growing conditions, and processing methods. For instance, the New Zealand Food Composition Tables note that approximately 16% of their component values are borrowed or derived from other data sources when direct analysis isn't feasible - a common practice that ensures comprehensive coverage while maintaining accuracy.
Modern food tables represent a global effort to catalog nutritional information. Countries maintain their own databases reflecting local food supplies and preparation methods, while international organizations work to harmonize standards. This creates a network of interconnected databases that support everything from local menu planning to international food trade.
What Are Food Tables?
Food tables are systematic compilations of nutritional data that present the nutrient content of foods in a standardized format. Think of them as the nutritional DNA profiles of everything we eat, broken down into measurable components that can be compared, analyzed, and applied across different contexts.
The foundation of all food tables is the 100-gram standard - a universal measurement that allows for direct comparison between different foods. Whether you're comparing the protein content of chicken breast to tofu or the fiber content of white bread to whole grain, the per-100-gram format provides an apples-to-apples comparison that cuts through the confusion of varying serving sizes and packaging claims.
These tables go far beyond the basic nutrition facts panel you see on packaged foods. While a typical food label might show 8-10 nutrients, comprehensive food tables can include hundreds of components. The complete New Zealand FOODfiles dataset, for example, tracks up to 360 different food components, including trace minerals, amino acid profiles, and fatty acid breakdowns that never appear on consumer labels.
The beauty of food tables lies in their systematic approach. Foods are categorized into logical groups - dairy products, meats, vegetables, grains - making it easy to find what you need and compare similar items. This organization proves invaluable when you're developing recipes, calculating nutritional information for menu items, or making ingredient substitutions.
Types of Food Tables & Databases
The landscape of nutritional databases offers options ranging from quick-reference concise tables to comprehensive research databases. Understanding these different types helps you choose the right tool for your specific needs.
Concise tables serve as the workhorses of the food industry. The Concise New Zealand Food Composition Tables, for instance, contain data for 1,281 foods with 38 core components - covering 46% of the foods in the complete database but focusing on the most commonly consumed items and essential nutrients. These streamlined versions are perfect for day-to-day restaurant operations, providing all the information needed for menu planning and basic nutrition labeling without overwhelming detail.
Comprehensive databases like FOODfiles™ and the USDA Food Data Central offer exhaustive detail for research and specialized applications. These databases can track hundreds of components per food item, including detailed amino acid profiles, individual fatty acids, and trace compounds that matter for specific dietary needs or scientific research.
The distinction between branded and generic products creates another important category. Generic entries represent average values for food categories (like "cheddar cheese" or "whole wheat bread"), while branded entries provide specific data for particular products. Most food tables focus on generic foods, though some databases increasingly include branded products to reflect the reality of modern food choices.
| Feature | Concise Tables | Comprehensive Databases |
|---|---|---|
| Number of foods | 1,200-1,500 | 2,500-8,000+ |
| Components tracked | 30-40 key nutrients | 100-360+ components |
| File size | Under 10MB | 50MB+ |
| Best for | Daily operations, menu planning | Research, specialized analysis |
| Update frequency | Every 2-3 years | Annual updates |
Reading & Using Food Tables
Successfully navigating food tables requires understanding both what the numbers mean and how to apply them in real-world situations. Like learning to read a map, once you understand the symbols and scale, these databases become powerful navigation tools for nutritional decision-making.
The data structure follows a logical pattern across most food tables. Each entry typically includes the food name, preparation method, and then columns for various nutrients. Energy values appear in both kilojoules and calories, followed by macronutrients (protein, fat, carbohydrates), then micronutrients (vitamins and minerals) in descending order of typical significance.
Understanding the reference standards is crucial. The per-100-gram format provides the baseline for all comparisons, but most tables also include common standard measurements (CSM) that reflect how people actually consume foods. For a pizza restaurant, this might mean seeing data for both 100 grams of cheese and per 1-ounce serving, making it easier to calculate nutritional information for your recipes.

Key Components Listed in Food Tables
The nutritional components in food tables follow a hierarchy from the most fundamental to the most specialized. Energy always comes first, typically expressed in both kilojoules and calories using standard conversion factors: protein and carbohydrates at 17 kJ/g, fat at 37 kJ/g, alcohol at 29 kJ/g, and fiber at 8 kJ/g.
Macronutrients form the backbone of nutritional analysis. Protein values indicate both quantity and, in advanced tables, quality through amino acid profiles. Fat content breaks down into total fat, saturated fat, and sometimes individual fatty acids. Carbohydrate data typically separates into total carbohydrates, sugars, starch, and dietary fiber - distinctions that matter greatly for menu planning and customer health considerations.
Micronutrients encompass the vitamins and minerals that support health but don't provide energy. Key vitamins include A, the B-complex group, C, D, E, and K, while essential minerals cover calcium, iron, magnesium, phosphorus, potassium, sodium, and zinc. Advanced tables may include trace elements like selenium, copper, and manganese.
Specialized components in comprehensive databases can include alcohol content, caffeine levels, cholesterol, and even specific compounds like beta-carotene or individual amino acids. For restaurants, understanding which components matter most for your menu and customer base helps focus your attention on the most relevant data.
The sum of proximate components (ash, water, fat, protein, sugars, starch, dietary fiber, and alcohol) typically falls within 95-105 grams per 100 grams of food - a useful quality check when reviewing nutritional data for accuracy.
Interpreting Numbers & Dealing With Limitations
Real-world application of food tables requires understanding their inherent limitations and variability. Food composition isn't as precise as chemical formulas - natural variation means that two apples from the same tree can have different vitamin C content, and processing methods can significantly alter nutritional profiles.
The research shows that food composition data can vary substantially by batch, season, processing practices, and country of origin. This variability explains why food tables often represent average values rather than exact measurements. Smart users understand these numbers as reliable estimates rather than absolute truths.
Borrowed values represent about 16% of the data in many food tables, used when direct analysis isn't practical or cost-effective. These values come from similar foods, related databases, or calculated estimates based on recipes and processing methods. While less precise than direct analysis, borrowed values fill important gaps and maintain database completeness.
Cooking losses present another crucial consideration. Raw food values don't account for nutrient changes during cooking, which can be substantial. Boiling vegetables can reduce water-soluble vitamins by 25-50%, while cooking methods that retain cooking liquids preserve more nutrients. Some tables include cooking reduction percentages to help estimate these losses.
Rounding rules affect how precisely you can use the data. Most tables round values to appropriate significant figures - energy to the nearest 5-10 calories, protein to 0.1 grams, vitamins to appropriate units. Understanding these conventions helps set realistic expectations for precision in your calculations.
Scientific research on nutrient retention provides valuable guidance on how cooking methods affect nutritional content, helping you make more accurate estimates for prepared foods.
Standard Measurements & Serving Sizes
While the 100-gram standard provides the foundation for food tables, practical applications require translation into real-world portions. Common standard measurements (CSM) bridge this gap by providing nutritional information for typical serving sizes that people actually consume.
Household measures make food tables accessible to everyone. Instead of calculating what 100 grams of flour looks like, you can find values for 1 cup, 1 tablespoon, or 1 teaspoon. For restaurant applications, this means you can easily scale recipes and calculate nutritional information for actual menu portions.
Per-serving data becomes particularly valuable for menu planning. When developing a new pizza recipe, you need to know the nutritional contribution of each ingredient in the amounts you'll actually use - 2 ounces of cheese, 1/4 cup of sauce, specific amounts of toppings. Food tables with good CSM data make these calculations straightforward.
The challenge lies in standardizing what constitutes a "serving." A slice of bread might be 25 grams in one table and 30 grams in another, affecting all the nutritional calculations. Successful restaurant operators learn to verify serving size definitions and adjust calculations accordingly.
More info about kitchen prep tables can help you set up your kitchen workspace to accurately measure and portion ingredients according to your nutritional calculations.
Who Uses Food Tables & Why They Matter
The applications of food tables span far beyond restaurant kitchens, touching every aspect of the food system from farm to table. Understanding who relies on this data and why helps illustrate the critical role these databases play in modern food service and public health.
Dietitians and nutritionists represent the most obvious users, relying on food tables to design meal plans, assess dietary intake, and counsel clients about nutrition. In clinical settings, precise nutritional information can be literally life-saving for patients with specific dietary restrictions or metabolic conditions.
Food industry professionals use food tables for product development, nutrition labeling, and regulatory compliance. When a food manufacturer reformulates a product or develops something new, food tables provide the baseline data needed to predict and verify nutritional content.
Researchers and academics depend on standardized food composition data for nutrition studies, public health research, and policy development. The consistency and reliability of food tables enable meaningful comparisons across studies and populations.
Restaurant operators increasingly turn to food tables for menu planning, nutrition labeling, and meeting customer demands for transparency. As consumers become more health-conscious and regulations require more disclosure, accurate nutritional information becomes a competitive advantage.
Public health officials use food table data to assess population nutrition, develop dietary guidelines, and create educational materials. National nutrition surveys rely on food tables to convert food consumption data into nutrient intake estimates.
Applications in Labeling, Planning & Policy
The practical applications of food tables extend into every corner of food service operations. Nutrition labeling represents perhaps the most visible use, where food tables provide the foundation for the nutrition facts panels that appear on packaged foods and increasingly on restaurant menus.
Menu engineering leverages food table data to optimize both nutrition and profitability. By understanding the nutritional profile of different ingredients, restaurants can develop healthier options without sacrificing taste or dramatically increasing costs. This data-driven approach to menu development helps balance customer health concerns with business objectives.
Dietary surveys and population health assessments rely heavily on food table data to convert food consumption information into nutrient intake estimates. When public health officials want to understand whether a population is getting enough vitamin D or too much sodium, food tables provide the conversion factors needed to analyze dietary survey data.
Nutrient claims on menus and marketing materials must be substantiated with accurate data. When a restaurant claims a dish is "high in protein" or "low in sodium," food tables provide the documentation needed to support these claims and comply with regulatory requirements.
School meal programs use food table data to ensure meals meet nutritional standards while managing costs. The precision required for these programs - where meals must meet specific nutritional criteria while staying within budget constraints - demonstrates the practical importance of accurate food composition data.
Updating & Maintaining Accuracy
The dynamic nature of the food supply requires constant attention to keeping food tables current and accurate. Sampling protocols ensure that analyzed foods represent what people actually consume, accounting for seasonal variations, different suppliers, and changing agricultural practices.
New foods and ingredients constantly enter the market, requiring ongoing analysis and database updates. The rise of plant-based meat alternatives, ancient grains, and exotic fruits means food tables must continually expand to remain relevant.
Reformulation of existing products creates another update challenge. When food manufacturers change recipes to reduce sodium, eliminate trans fats, or add nutrients, food tables must be updated to reflect these changes. This ongoing process explains why major food composition databases release new editions every 2-3 years.
Edition cycles balance the need for current information with the practical constraints of analysis costs and database management. The New Zealand Food Composition Tables, for example, follow a regular update schedule that incorporates new analytical data, adds new foods, and removes outdated entries.
Stakeholder input helps prioritize which foods and nutrients to analyze in each update cycle. Food industry feedback, public health priorities, and research needs all influence the decision-making process for database updates.
Scientific research on New Zealand database provides an excellent example of how national food composition databases maintain accuracy and relevance through systematic update processes.
Challenges & The Future of Food Tables
The evolution of food tables faces several significant challenges that will shape their development in the coming years. Data gaps remain a persistent issue, particularly for ethnic foods, regional specialties, and rapidly changing processed foods. While major databases cover thousands of foods, the actual variety of foods consumed globally far exceeds what any single database can comprehensively catalog.
Emerging nutrients present another challenge as nutritional science advances. New research constantly identifies additional compounds that may have health significance - from specific antioxidants to novel fatty acids. Food tables must balance comprehensiveness with practicality, deciding which new components warrant the expense of widespread analysis.
Bioavailability represents a frontier that traditional food tables haven't fully addressed. The amount of a nutrient present in food doesn't always equal the amount the human body can actually use. Future food tables may need to incorporate bioavailability factors, making them more complex but also more useful for health applications.
Branded product churn creates a practical challenge as food companies constantly introduce new products, discontinue old ones, and reformulate existing items. The pace of change in the processed food market makes it difficult for food tables to keep up with branded product information.
Technology integration offers promising solutions to these challenges. Artificial intelligence and machine learning could help predict nutritional composition of new foods based on ingredients and processing methods. Blockchain technology might enable real-time updates from food manufacturers directly into composition databases.
Open data initiatives are making food composition information more accessible and collaborative. Instead of isolated national databases, the future may see interconnected global systems that share data and analytical methods across borders.

Frequently Asked Questions about Food Tables
How often are food tables updated?
Most comprehensive food tables follow update cycles of 2-3 years for major editions, with minor updates and corrections occurring more frequently. The New Zealand Food Composition Tables, for example, released their 14th edition in 2021, following their 13th edition from 2018. These regular cycles balance the need for current information with the substantial costs of food analysis and database maintenance.
Between major editions, databases often receive incremental updates to add new foods, correct errors, or incorporate new analytical data. The timing of updates depends on several factors including available funding, analytical capacity, stakeholder priorities, and significant changes in the food supply such as widespread reformulation or new food trends.
Are branded products included?
Traditional food tables focus primarily on generic foods rather than specific branded products. For example, you'll find entries for "cheddar cheese" or "whole wheat bread" representing average values across multiple brands, rather than specific entries for particular brand names.
However, this approach is evolving. Some databases now include branded products, particularly for foods where brand variations are significant or where generic categories don't adequately represent the market. The challenge lies in the rapid pace of product reformulation and the practical impossibility of analyzing every branded product in the marketplace.
For restaurant applications, this means food tables provide good baseline estimates, but you may need to obtain specific nutritional information directly from suppliers for branded ingredients where precision is critical for labeling or dietary compliance.
Can I use food tables for commercial labeling?
Food tables can provide valuable reference data for commercial nutrition labeling, but their use must comply with relevant regulations and accuracy requirements. In the United States, FDA regulations allow the use of databases like the USDA Food Data Central for nutrition labeling, but the manufacturer remains responsible for label accuracy.
For restaurant menu labeling, food tables often provide the foundation for nutritional calculations, especially when combined with standardized recipes and portion control. However, establishments must ensure their calculations reasonably represent the actual nutritional content of foods as prepared and served.
The key is understanding that food tables provide estimates based on average values and standard preparation methods. When using this data for commercial purposes, consider factors like ingredient variations, cooking methods, and portion sizes that might affect the final nutritional content of your menu items.
Conclusion
Food tables represent one of the most practical tools available to restaurant operators who want to make informed decisions about nutrition, labeling, and menu development. From the comprehensive databases containing thousands of foods to the concise tables perfect for daily operations, these resources provide the foundation for data-driven food service.
The research clearly shows that modern food composition databases offer unprecedented detail and accuracy. With resources like the New Zealand FOODfiles containing data for over 2,760 foods with up to 360 components, or the USDA databases covering thousands of American foods, restaurant operators have access to more nutritional information than ever before.
At PizzaPrepTable.com, we understand that successful restaurant operations depend on having the right information and the right equipment. Just as we help our customers in New York City, Los Angeles, Chicago, and across the country choose the perfect prep tables for their operations, we believe in empowering food service professionals with the knowledge they need to succeed.
The practical applications are clear: use food tables to develop accurate nutrition labels, plan balanced menus, meet regulatory requirements, and respond to customer health concerns. Whether you're calculating the nutritional content of your signature pizza or developing new menu items that meet specific dietary needs, these databases provide the reliable foundation you need.
Food tables are tools, not absolute truths. Understanding their limitations - from natural variation in food composition to the effects of cooking methods - helps you use them more effectively. The goal isn't perfect precision but rather informed decision-making based on the best available data.
As the food service industry continues to evolve toward greater transparency and health consciousness, food tables will become even more valuable. Restaurants that learn to leverage this nutritional data effectively will find themselves better positioned to meet customer expectations, comply with regulations, and build trust through transparency.
For restaurant operators ready to take their nutritional planning to the next level, we recommend starting with concise food composition tables that cover the foods most relevant to your operation. These resources, combined with proper kitchen equipment and systematic approaches to recipe development, can transform how you think about nutrition in your food service operation.
More info about pizza prep solutions can help you implement the systematic approaches to food preparation that make nutritional calculations more accurate and menu planning more efficient.